Stop using dd() to debug Laravel code use this free tool instead
ASIF IQBAL . Follow
1 year ago

Laravel is a popular PHP framework for web development. It provides several features that make it easy to create complex web applications. However, debugging Laravel code can be difficult. One common method for debugging Laravel code is to use the dd() function. However, the dd() function can be slow and inefficient. In this article, we will discuss a better way to debug Laravel code. We will recommend a free tool that is specifically designed for debugging Laravel code. We will also provide examples of how to use the tool. We hope that this article will help you to debug your Laravel code more easily and efficiently.
The old way problems:
use dd() can be a fast method but it came with many limitations:dd() function will stop the execution of the script
dump() function allows the script to be fully executed but you will not get the normal result on the screen
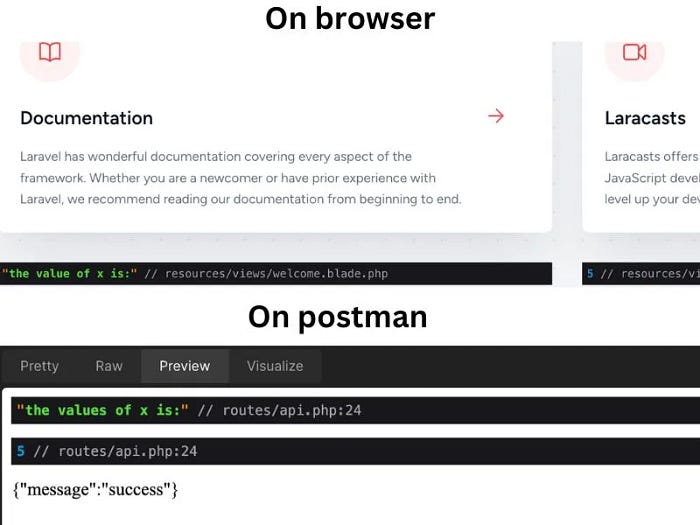
we are trying here to debug an integer variable value
it’s even worse when we are trying to debug a Laravel model instance
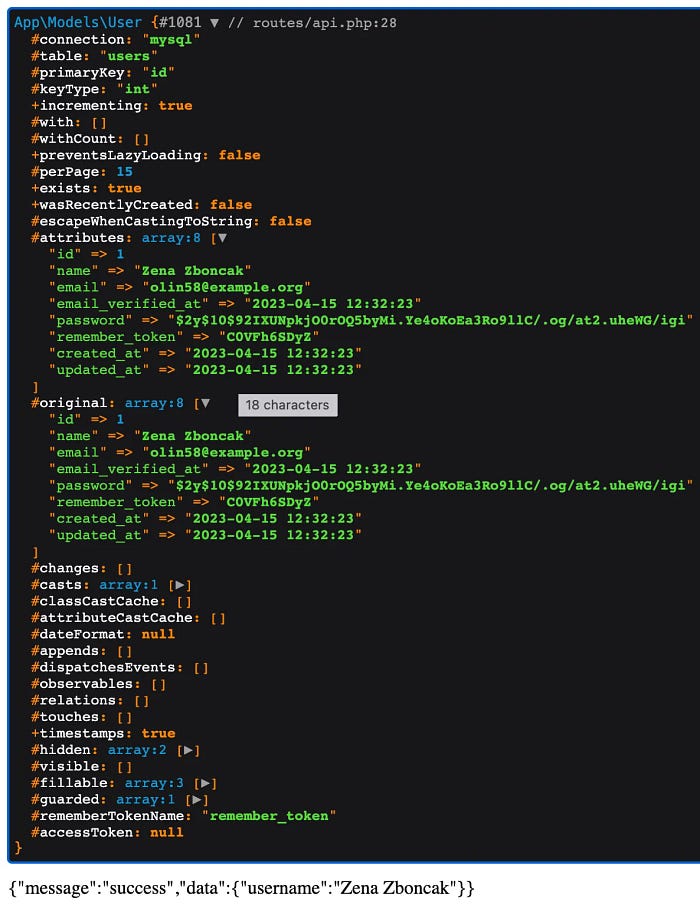
see how much information you got when you only need a few
but don’t worry Laravel community has a solution for this
what if say that you can get only the information you want in a beautiful interface without breaking the response
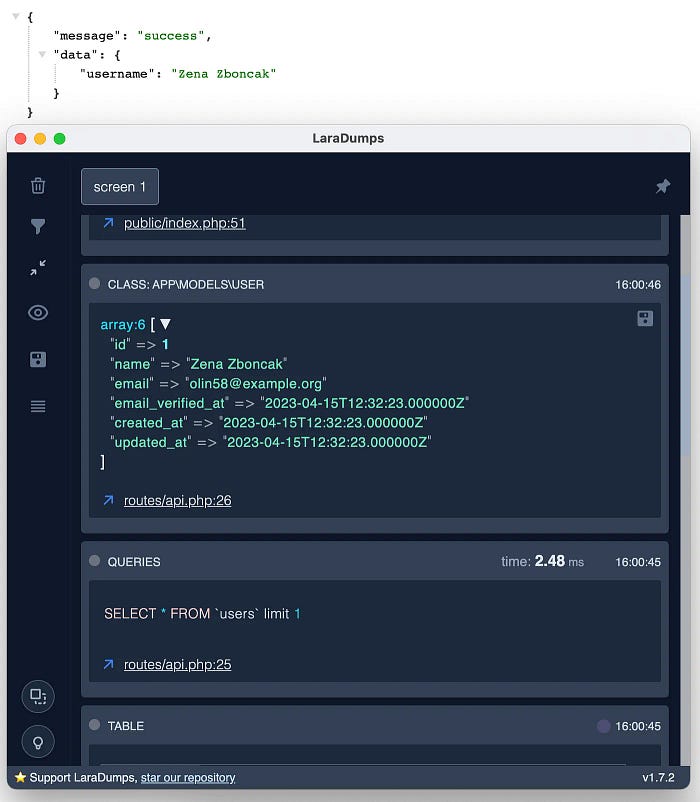
not just that but we also get the SQL query and the execution time
amazing right?
So what is this tool?
LaraDumps is a friendly app that boosts your Laravel PHP coding and debugging experience.
How do we install it?
1․ Download the LaraDumps desktop application.
2․ Add the LaraDumps Laravel package to your Laravel project.
3․ Start debugging!
Desktop app
The current LaraDumps version is 1.7.2
Windows: Click to download the installer here
macOS: Click to download the Apple disk image here
Linux: download using Snapcraft
Laravel Package
Requirements: PHP 8.0+ and Laravel 8.75+
1․ Install LaraDumps Package in your Laravel project using Composer.
Run the command:
composer require laradumps/laradumps --dev
2․ Now, configure LaraDumps. Run the command below:
php artisan ds:init
The wizard will guide you through the configuration options.
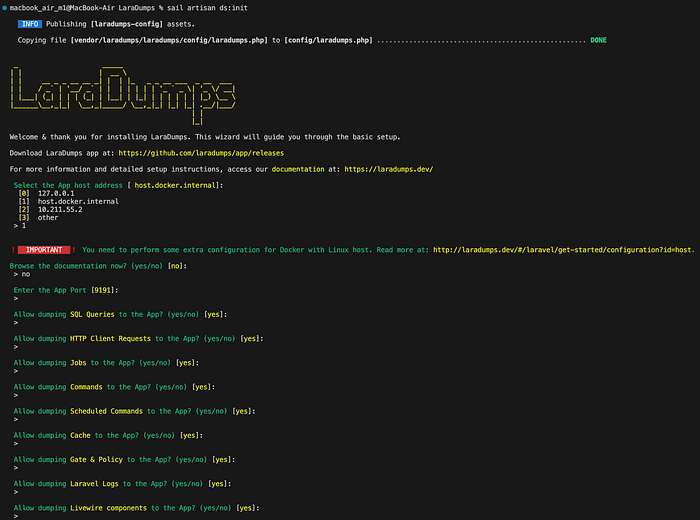
just note that I am using docker so when I asked about the app host address I choose the host.docker.internal otherwise you should use the app address using 1,3 or other if your using another address
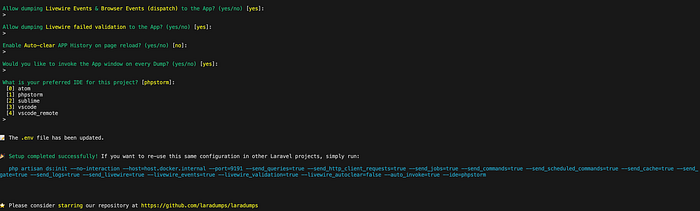
now we are ready for the final step.
Debugging
to use it simply use ds() function instead of dd() or dump()
you will get the result on the desktop app and the application will continue working unlike when using dd()
Debugging tools
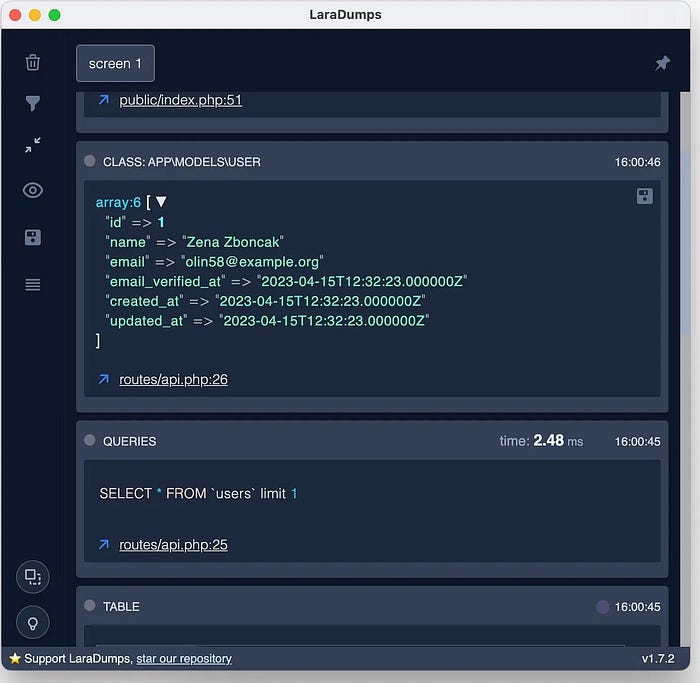
Debug Model:
ds()->model(User::first());
will generate:
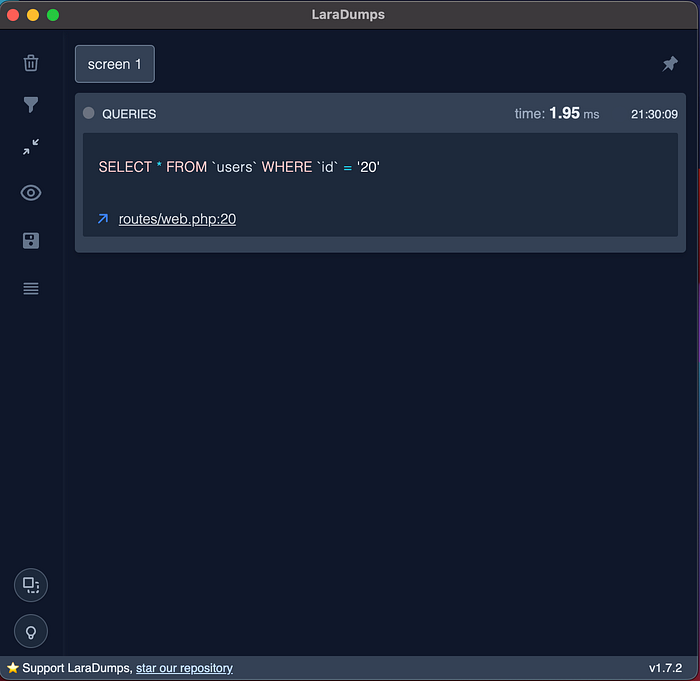
Debug SQL query:
    ds()->queriesOn();

    User::query()->where('id', 20)->get();

    ds()->queriesOff();


    // or you can you this for a single query
      User::query()->where('id', 20)
          ->ds()
          ->get();
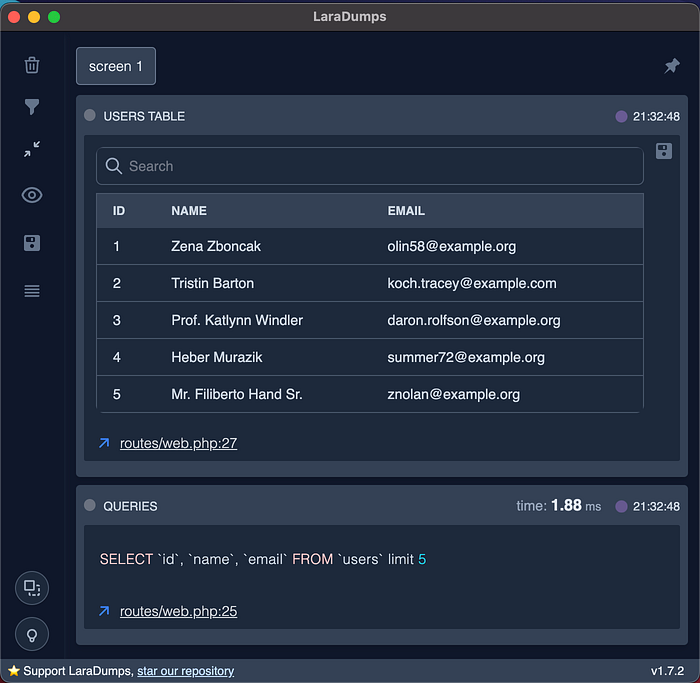
View data in a table:
 $users = User::query()
        ->select([
            'id',
            'name',
            'email'
        ])
        ->limit(5)
        ->get();

  ds()->table($users, 'users table');
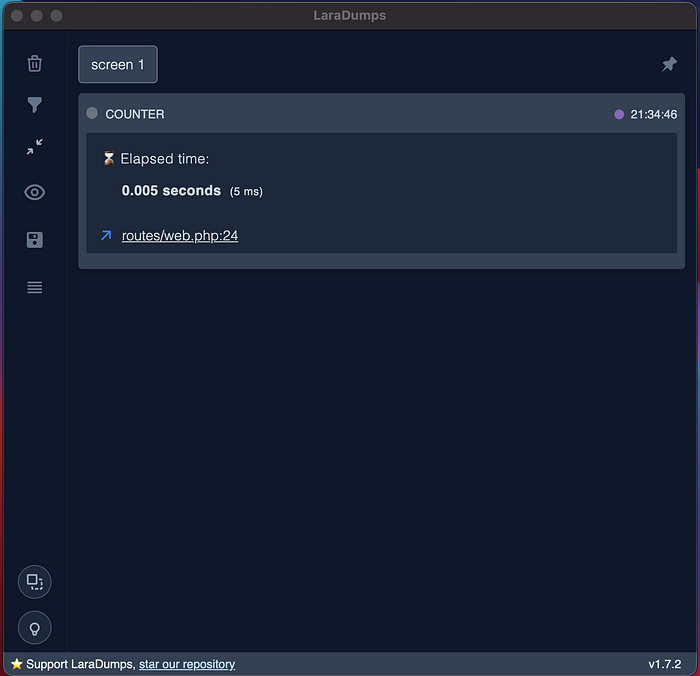
Get the execution time:
 ds()->time('counter');

 for($i=0; $i<100000; $i++){
    //some code
 }

 ds()->stopTime('counter');
not just this also you can debug:
- HTTP request
- Mailable
- Artisan command
- Jobs
- Cache
- Collection
- Routes
- Strings
- JSON
and a lot more
if you still want the execution to stop you can use die()
ds(['string'])->die();
and for those who forget the debugging code and push it to git
LaraDumps has an artisan command which will produce an error if any ds() is found in your code.
php artisan ds:check
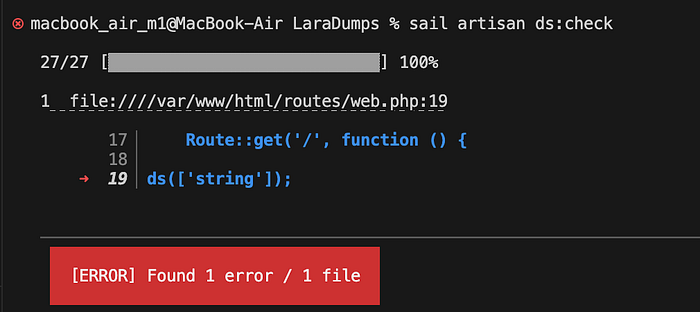
by default its searches only inside the app and the resources folders you can update this in config/laradumps.php
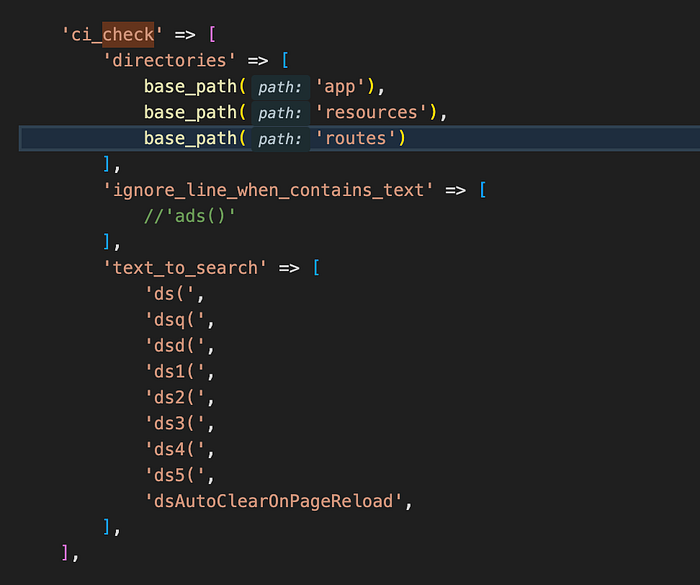
You can also add a custom verify script in your composer.json, and run composer verify in your deployment pipeline (CI/CD).
"scripts": {
   "ds:check": "@php artisan ds:check",
   "verify": [
         "@ds:check",
   ],
}
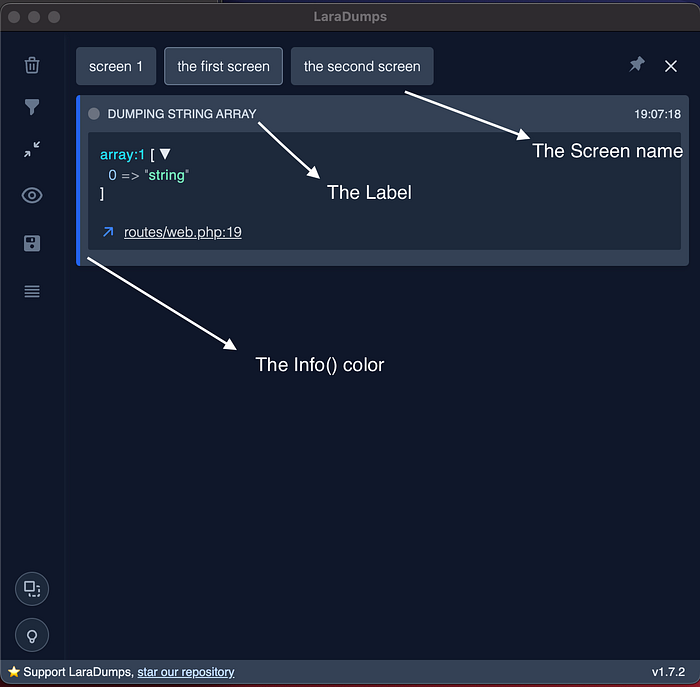
Visual enhancement
if you are debugging multiple variables together
you can add labels, have multiple screens, add colors
 ds(['string'])
        ->label('dumping string array')
        ->toScreen('the first screen')
        ->info();

 ds()->model(User::first())
     ->toScreen('the second screen');
available colors:
info()=> bluewarning()=> orangedanger()=> redsuccess()=>greencolor()=> custom color
Debug without invoking the desktop app
By default, LaraDumps Desktop App will be invoked and gain focus whenever a new dump arrives.
To disable this behavior, change the .env file key DS_AUTO_INVOKE_APP to false.
DS_AUTO_INVOKE_APP=false
You can also send Quiet Dumps and the app will not be invoked.
dsq('quiet dump');
you can check the full documentation for additional information
Note: if you want to not automatically send all the quires to the application
you can put
DS_SEND_QUERIES = false
in order to only send the queries to the app when manual dump it
this note can also be considered for all the features of the package
Conclusion:
we have discussed a better way to debug Laravel code. We have recommended a free tool that is specifically designed for debugging Laravel code. We have also provided examples of how to use the tool. We hope that this article has helped you to debug your Laravel code more easily and efficiently.
If you have any questions about using the tool, please feel free to leave a comment below. I will be happy to help you out.
Thank you for reading!
for more articles follow me here and also you can follow me through:
LinkedIn
Recommended topics
Recommended from Guest Post
Lena Interprets
The Future of Communication: Remote Interpreting for Modern Malaysian Businesses
July 25, 2024Singapore ESG Business
Corporate Accountability: How ESG Audits Are Evolving in 2024
October 22, 2024
Global Business Directory
25 Active business directory & listing sites in French Guiana
June 24, 2024Nugroho Tyas
Legal Translation Services in Singapore: Why You Need Them for KYC Documents
September 13, 2024Rahul Mishra
Popular Nasha Mukti Kendra in Ghaziabad: Leading the Way to Recovery
September 21, 2024
Motion Hospitality
MD ASIF IQBAL
2023-06-10 5:54 PM
Nice
ASIF IQBAL
2023-06-10 5:53 PM
Great